AWS Gen AI Competency
Generative AI · Structured Data
FusionReport
A Leading Insurance Enterprise Cuts Reporting Time from 1 Week to Minutes — by Talking to Its Own Data
 
With daily transaction data across a star schema data warehouse and four business teams waiting weeks for every insight, this enterprise deployed FusionReport — P3Fusion's Generative AI analytics platform — and gave every team the ability to query, visualise, and act on their structured data instantly, without a single data engineer in the loop.
 
FusionReport
Amazon Bedrock
Generative AI · SQL Generation
Star Schema · Daily Transactions
Insurance Enterprise
4 Business Teams
 
 
Results at a Glance
 
Industry: Insurance (Enterprise) · Data architecture: Star schema DWH · Data volume: Daily transactions · Teams deployed: Fraud, Claims, Risk, Gov · LLM platform: Amazon Bedrock


Executive Summary
A large insurance enterprise operating with daily transaction data across a star schema data warehouse faced a reporting crisis that is universal in data-heavy financial services organisations: every insight required a multi-week pipeline — business teams would raise a reporting request, data engineers would spend days building intermediate data models, analysts would spend further days building dashboards, and by the time the decision-maker received the output, the operational moment had often passed. P3Fusion deployed FusionReport, its Generative AI analytics platform built on Amazon Bedrock, across four business units — Fraud Detection, Claims Management, Risk Analytics, and Governance & Compliance. By connecting FusionReport directly to the enterprise's star schema data warehouse using only database metadata, business users across all four teams can now ask natural language questions against live transactional data and receive optimised SQL-generated results, instant Plotly visualisations, and analysis-driven insights — all processed within the enterprise's own compute environment, with zero data leaving their control. Reporting time dropped from one week to under 30 minutes. Data engineers were freed from ad-hoc report requests entirely. And decision-makers now have the data-driven insights they need in the moment they need them — not seven days later.
About the Customer
An Insurance Enterprise Processing Millions of Daily Transactions — With Reporting Stuck in the Past
The customer is a large insurance enterprise managing policy administration, claims processing, fraud detection, risk assessment, and regulatory compliance across a complex operational environment. Their data warehouse operates on a classic star schema architecture — fact tables recording daily policy events, claims transactions, premium payments, and fraud signals, with surrounding dimension tables for products, agents, geographies, and time. The organisation processes millions of transactions daily, accumulating one of the most data-rich operational environments in the insurance sector.
 
Four distinct business units depended on this data to run their operations: the Fraud Detection team, the Claims Management team, the Risk Analytics team, and the Governance and Compliance team. Each had unique analytical needs — different fact tables, different aggregation logic, different KPIs. And each faced the same fundamental problem: they could not access their own data without going through a lengthy, resource-constrained pipeline that turned every insight into a week-long project.
 
The Challenge
A Week to Answer Any Question. Data Everywhere, Insights Nowhere.
The enterprise's data warehouse held everything a decision-maker could need. Fraud patterns, claims velocity, loss ratios, premium trends, compliance exceptions — all of it existed, updated daily, sitting in a star schema that modelled the business with precision. The problem was not the data. The problem was the pipeline every team had to navigate before they could reach it.
// The Old Reporting Pipeline — Every Single Request❌ Before FusionReport
Business
Business Team
raises request
Day 0
Data Eng
Data engineer
builds data model
+2–3 days
SQL Query
SQL queries
written & tested
+1–2 days
Analyst
Analyst builds
dashboard
+1–2 days
Review
QA & review
cycle
+1 day
Decision
Decision-maker
receives insight
~1 week later
Total time from question to insight:5–7 business days
Every report took 1 week minimum

Even the simplest analytical question — "what is the claims approval rate this month by product line?" — required raising a formal request, waiting for a data engineer, and then an analyst before any answer appeared.

🔧
Data engineers became a bottleneck

The data engineering team spent the majority of their capacity building ad-hoc intermediate data models for business requests — work that consumed skilled engineers and prevented investment in strategic data infrastructure.

📉
Decisions made without current data

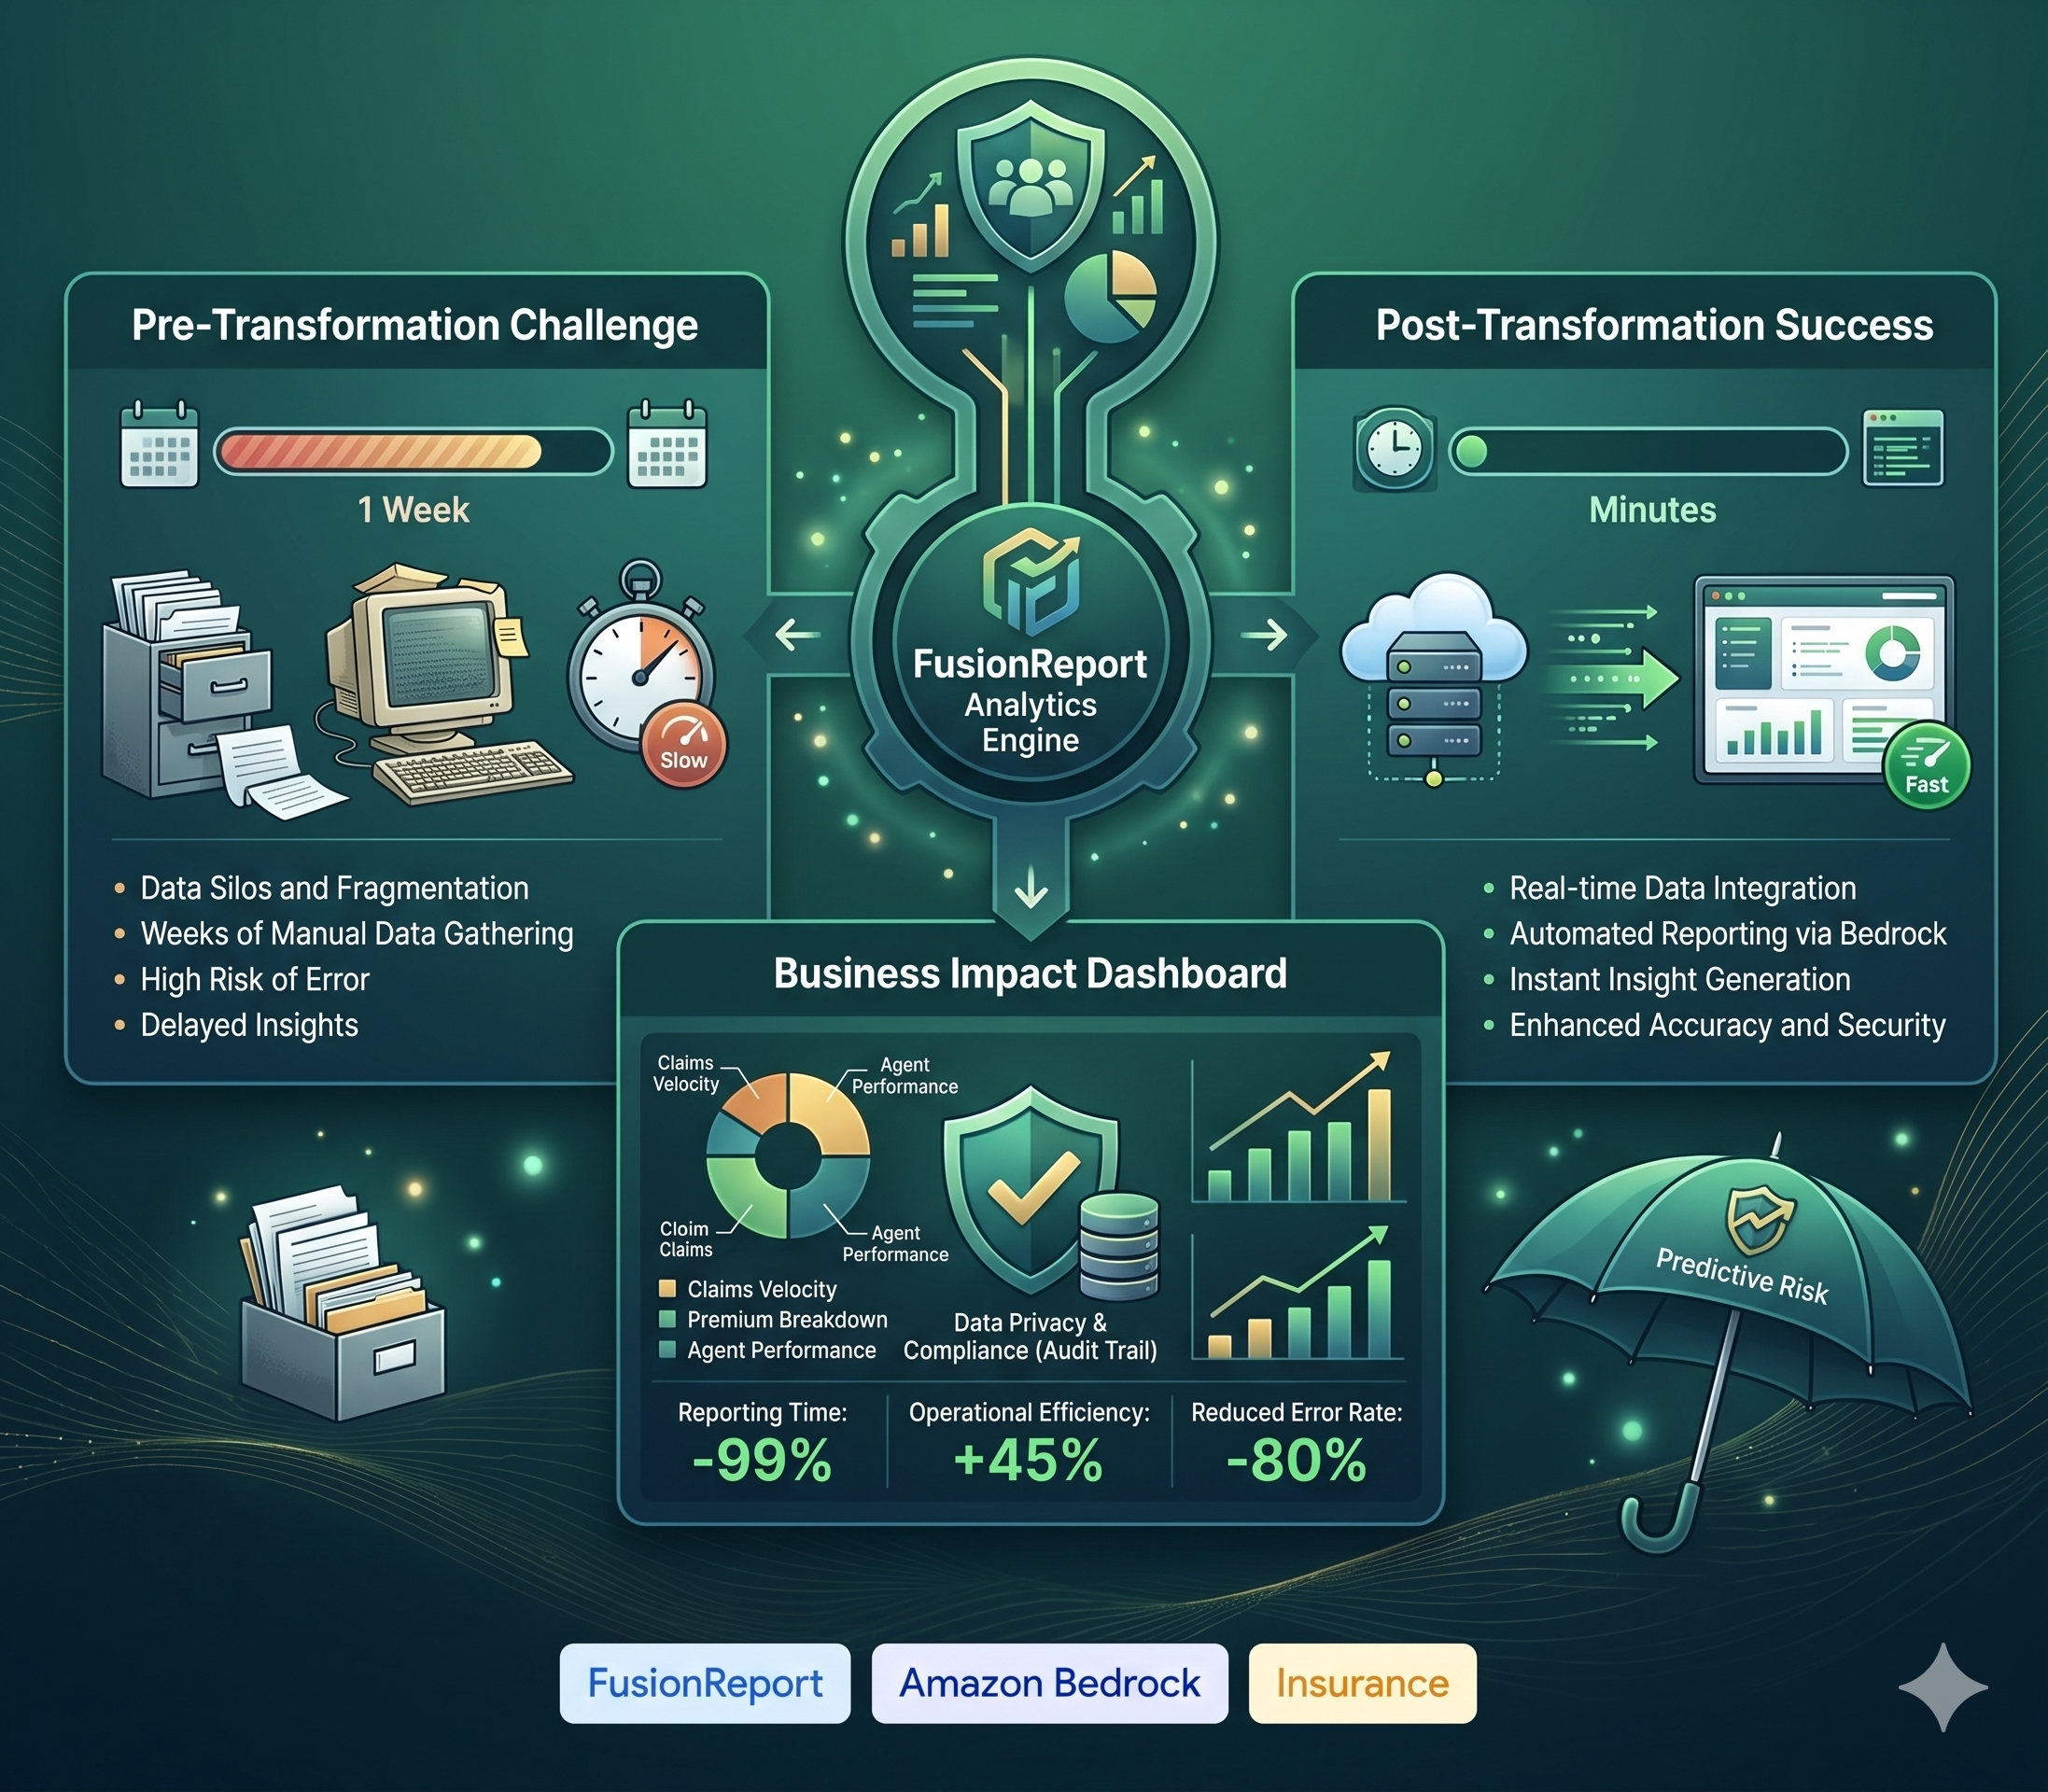
By the time a fraud pattern report arrived, the fraudsters had moved on. By the time a claims trend dashboard was built, the operational window for intervention had closed. Stale insights drove reactive decisions.

🔄
Every new insight required the whole pipeline again

A follow-up question — "now break that down by region" — triggered the entire cycle again. Four business teams, each needing iterative analysis, were multiplying the pipeline burden with every question they had.

Our fraud team was sitting on top of a gold mine of transactional data. But by the time we could actually see it, the patterns we needed to act on had already changed. We were always one week behind where we needed to be.

— Chief Data Officer, Insurance Enterprise (name withheld)

 
Why FusionReport
Generative AI That Speaks Your Database's Language — Without Touching Your Data
FusionReport is P3Fusion's Generative AI analytics platform built specifically for structured data environments. Unlike general-purpose business intelligence tools that require predefined data models and dashboard templates, FusionReport uses LLM-powered SQL generation on Amazon Bedrock to translate any natural language business question directly into an optimised, dialect-aware SQL query — executing it against the enterprise's own database and returning structured results, instant charts, and analytical insights in one response.
 
The critical differentiator for this insurance enterprise was FusionReport's architecture: it required only database schema metadata to operate. No intermediate data models to build. No ETL pipelines to maintain. No pre-built dashboards to commission. FusionReport's LLM analyses the star schema structure — fact and dimension table relationships, column types, foreign keys — and generates contextually aware SQL that navigates join paths correctly, applies appropriate aggregations, and structures results for the requested visualisation type. The entire pipeline from question to chart runs inside the enterprise's own compute environment. No data is transmitted externally. No proprietary transactional data leaves the organisation's control.
 
How FusionReport Works
Natural Language In. Optimised SQL Out. Instant Insight Delivered.
FusionReport's pipeline is a five-stage Generative AI engine — from natural language business question through to rendered visualisation — running entirely within the enterprise's AWS environment on Amazon Bedrock.
// FusionReport Pipeline — Amazon Bedrock · Your Compute · Your Data✓ After FusionReport
1
Query Classification — LLM Intent Engine

The business user's natural language question is classified by an LLM agent — determining whether it requires SQL/data retrieval, statistical analysis, metric calculation, or a general response. Prevents unnecessary database calls and routes each query to the optimal processing path.

LangChain · Claude 3.5 Sonnet · Amazon Bedrock
<1sClassification
2
Schema Linking — Star Schema Intelligence

FusionReport loads the enterprise's database schema metadata — fact tables, dimension tables, foreign key relationships, column types. The LLM performs schema linking: identifying which tables and columns are relevant to the question and mapping the correct join paths through the star schema.

Database Metadata Only · No Raw Data Sent to LLM
<1sSchema load
3
Optimised SQL Generation — Sub-Question Decomposition

The LLM decomposes complex questions into sub-questions, generates optimised SQL for each, and assembles the final query. Self-correction validates the SQL before execution — catching join errors, column mismatches, and aggregation mistakes. Supports PostgreSQL and MySQL dialects natively. Every query is read-only — data modification is blocked by design.

Multi-step SQL generation · Dialect-aware · Self-correcting
2–4sSQL gen
4
In-Environment Query Execution — Your Compute, Your Data

The validated SQL executes directly against the enterprise's database using an async query engine within their own AWS environment. Results are returned as a structured DataFrame. No data leaves the organisation's compute boundary at any point. The enterprise's existing database security, access controls, and network policies remain fully in effect.

AsyncPG · SQLAlchemy · Runs in your VPC
VariesDB execute
5
Instant Visualisation — AI-Generated Plotly Charts

The resulting DataFrame is passed to a second LLM call on Amazon Bedrock, which generates production-ready Plotly visualisation code — selecting the optimal chart type (bar, line, scatter, pie, KPI card) for the data structure and question context. Charts render instantly in the browser with proper axis labels, titles, and colour schemes.

Plotly Express · Auto chart selection · Instant render
<3sChart gen
FusionReport · Generative AI SQL Engine · Insurance EnterpriseLLM: Claude 3.5 Sonnet · Amazon Bedrock
Fraud Analyst · Natural Language Query
Show me the top 10 agents by suspicious claim count in the last 90 days, broken down by claim type, and flag any agent where suspicious claims exceed 15% of their total submissions.
FusionReport · Optimised SQL Generated · Star Schema Analysis
-- FusionReport: Schema linked → fact_claims JOIN dim_agents JOIN dim_claim_types
-- Sub-question decomposition: suspicious count + total count + ratio calculation

WITH agent_claim_summary AS (
  SELECT
    da.agent_id,
    da.agent_name,
    dct.claim_type_name,
    COUNT(*) AS total_claims,
    SUM(CASE WHEN fc.fraud_flag = 1 THEN 1 ELSE 0 END) AS suspicious_claims,
    ROUND(
      SUM(CASE WHEN fc.fraud_flag = 1 THEN 1 ELSE 0 END) * 100.0
      / COUNT(*), 2
    ) AS suspicious_pct
  FROM insurance.fact_claims fc
  JOIN  insurance.dim_agents da  ON fc.agent_key = da.agent_key
  JOIN  insurance.dim_claim_types dct ON fc.claim_type_key = dct.claim_type_key
  JOIN  insurance.dim_date dd ON fc.date_key = dd.date_key
  WHERE dd.full_date >= CURRENT_DATE - INTERVAL '90 days'
  GROUP BY da.agent_id, da.agent_name, dct.claim_type_name
)
SELECT *, 
  CASE WHEN suspicious_pct > 15 THEN '⚠ FLAGGED' ELSE 'OK' END AS risk_flag
FROM agent_claim_summary
ORDER BY suspicious_claims DESC
LIMIT 10;
Tables joined: 4Query type: SELECT onlyChart: Grouped bar + flag columnTotal time: 4.2sData stays in: Enterprise VPC
This query — navigating a four-table star schema join with conditional aggregation, percentage calculation, and threshold flagging — was generated from a plain English sentence in 4.2 seconds. Before FusionReport, writing and validating this SQL would have taken a data engineer half a day. The fraud analyst who asked the question had no SQL knowledge. They simply asked what they needed to know.
 
Four Teams Transformed
Every Business Unit Now Operates as a Data-Driven Analytics Team
FusionReport was deployed across all four business units simultaneously, with each team's database access configured to their relevant fact tables and dimension views. Each team immediately gained the ability to perform self-service analysis against live transactional data — questions that previously required a formal engineering request now take seconds.
 
🔍
Fraud Detection Team
Fraud Analytics
Which agents have fraud flag rates above 15% in the last 90 days?
Show me claims submitted within 48 hours of policy inception by product type
What is the geographic distribution of denied claims this quarter?

Real-time fraud pattern analysis — patterns identified same day, not next week. Suspicious agent flagging moved from weekly review to continuous monitoring.

📋
Claims Management Team
Claims Operations
What is the average claims processing time by adjuster and claim type this month?
Show open claims by age bucket older than 30, 60, 90 days
What is our claims approval rate trend over the last 12 months?

Claims velocity dashboards that previously took 3 days to produce now refresh on demand. Adjuster performance analysis became a daily operational tool instead of a monthly report.

📊
Risk Analytics Team
Actuarial & Risk
What is the loss ratio by product line and region for this policy year?
Show combined ratio trend for commercial lines vs personal lines
Which risk segments have the highest claims severity in the last 6 months?

Actuarial teams gained self-service access to loss ratio and severity analysis — reducing their dependence on the data engineering team for routine analytical queries by an estimated 70%.

Governance & Compliance Team
Regulatory & Compliance
List all claims exceeding regulatory payment thresholds in the current reporting period
Show policy lapse rate by product and distribution channel this quarter
What is our complaints ratio against total policies in force by region?

Regulatory reporting that required full data engineering cycles now runs on demand. Compliance exceptions are identified in real time — not discovered during quarterly audit cycles.

 
Before & After
The Measurable Transformation
Before FusionReport
5–7 days
Average time from business question to delivered insight — for even simple analytical requests
4 teams
Waiting in a shared data engineering queue for every new report or dashboard
Reactive
Decisions made on last week's data — fraud patterns, claims trends, and risk signals always lagged
Manual SQL
Every analytical query hand-written by a data engineer — then passed to an analyst to visualise
After FusionReport
<30 min
Any insight — however complex — from natural language question to rendered chart and analysis
Self-serve
All four teams query their own data independently — no engineering tickets, no waiting, no bottleneck
Real-time
Daily transaction data queryable the moment it lands — fraud signals acted on same day, not next week
Generated SQL
LLM generates optimised, validated SQL from natural language — charts rendered automatically by Generative AI
 
Results
An Insurance Enterprise That Runs on Real-Time Data Intelligence
95%
Reduction in reporting time
5–7 days → under 30 minutes
4
Teams fully self-serve on live data
Fraud · Claims · Risk · Governance
0
Data engineers per query
Engineering capacity freed for strategic work
Fraud Detection Speed
Same-day patterns

Fraud signals that previously surfaced in weekly review reports are now identified the same day the transactional data lands — giving the fraud team an operational window to act before patterns escalate.

Engineering Capacity
~70% freed

Data engineering time previously consumed by ad-hoc business reporting requests has been redirected to strategic data infrastructure — an immediate uplift in engineering productivity and job satisfaction.

Data Security
Zero data egress

FusionReport operates entirely within the enterprise's AWS environment. Only database schema metadata is passed to the LLM — raw transactional data never leaves the organisation's compute boundary at any point.

Decision Quality
Insights-driven

Decision-makers across all four teams now enter meetings with data rather than waiting for it. The shift from reactive to proactive decision-making — driven by real-time transactional intelligence — was noted by the CDO within the first month.

The data engineering team used to spend most of their time building reports that should have been self-service. FusionReport gave four business teams the ability to answer their own questions — and gave our engineers their careers back.

— Chief Data Officer, Insurance Enterprise (name withheld)

 
Next Steps
Phase 2 — Predictive Analytics and Automated Regulatory Reporting
Building on FusionReport's success as a self-service analytical platform, the enterprise and P3Fusion are developing Phase 2: integrating Amazon SageMaker predictive models directly into FusionReport's query pipeline — enabling teams to ask forward-looking questions ("which policies are at highest risk of lapse next quarter?") alongside historical analysis. A second workstream will use FusionReport to automate the generation of standard regulatory reports — producing formatted compliance submissions directly from natural language report specifications, with full audit trail support.
Engagement Details
IndustryInsurance (Enterprise)
Data architectureStar schema DWH
Data volumeDaily transactions
Teams deployed4 business units
DB dialectsPostgreSQL · MySQL
Customer nameWithheld by request
 
Teams Deployed
Fraud Detection
Claims Management
Risk Analytics
Governance & Compliance
 
Tech Stack
Amazon Bedrock
Claude 3.5 Sonnet
LangChain · LangChain AWS
FastAPI · Async Python
SQLAlchemy · AsyncPG
Plotly Express
PostgreSQL · MySQL
Amazon S3 · CloudWatch
AWS VPC (in-environment)
 
P3Fusion

AWS Generative AI Competency Partner. FusionReport is P3Fusion's Generative AI analytics platform for structured data — turning any star schema, data warehouse, or relational database into a self-service insights engine on Amazon Bedrock.

Gen AI Competency
Connect SDP
FusionReport
InsightBot
Bedrock
RAG

Ready to see FusionReport on your warehouse? Book a demo with the team.

 
Related Case Studies
 
 
Scale Your Success with Confidence
 
P3Fusion is audited and certified by industry-leading third-party standards.